

As management theorist and author Peter Drucker said, “The greatest danger in times of turbulence is not the turbulence, it is to act with yesterday’s logic.” April saw a whirlwind of surprising news flow causing investors to suffer a commensurate roller coaster ride in stock price behavior. Let’s review April’s catalytic events and associated price action.
Both Stock and Bond Markets Speak Truth in April
The unremarkable S&P 500 return in April simply doesn’t capture the incredible drama investors endured last month. The S&P 500 ended April at roughly the same price level as where it stood toward the final days in March—slightly above 5500—making for a seemingly yawning result of flattish returns for the month. The investor experience during this period, however, was anything but boring––it was downright head-spinning. The month started off horribly and exhibited almost frightening form before staging a healthy rally to pair losses and provide needed relief in the month’s back half. The shockingly high tariff rates that President Donald Trump announced on April 2, interestingly referred to as “liberation day” by the President himself, sparked a sharp and immediate pullback in U.S. stocks.
Specifically, the S&P 500 dropped roughly 4.8% in price on the day following the after-hours announcement at a press conference at the White House. It fell another 7.7% in price in the ensuing three trading days through April 8, taking the index down to a closing low of 4983 on that date.1 During these tenuous couple of days, bond investors voiced their concerns about the financial markets, expressing worries over the potential inflationary effects of such sizable tariff levies by driving up the 10-year Treasury rate by roughly 45 basis points within just six trading days following the release of this startling tariff news. 2
By April 9, the Trump administration got the message from both the stock and bond markets and announced a 90-day pause on the tariffs, or a tariff time-out (TTO), that went into effect at midnight on the eighth. The pause will last through market open on July 9, giving the administration until then to make progress on discussions with various trading partners throughout the world.
The markets cheered … at least for a bit. On April 9 alone, the S&P surged over 474 points or 9.5% in price,3 demonstrating the coiled spring action potential in this market if just a hint of good news on the policy front develops. As of April 29, the S&P 500 has advanced roughly 12% from the April 8 low, and it is now back above the 5500 price level.4
Importance of Balance and Moderation
Little did we know just how prescient our 2025 thesis of Clear Air Turbulence would prove to be—along with our cautionary message to clients to anticipate intermittent pullbacks of 10-15% in large- and mid-cap U.S. stocks throughout the year, particularly in the first half, as various policy pronouncements unfold, before likely achieving new highs by year-end.
Signs of investor skepticism didn’t just surface in April; it had been brewing for some time. The volatility in both the aggregate S&P 500 index, and in its various groupings of internal constituents, extends well beyond the month of April. It goes back as far as Feb. 19, when the index stood at an all-time price level high of 6144.5 From that point, up until the tariff/“liberation day”-inspired low on April 8, the S&P 500 fell 19% in price—almost crossing into official bear market territory, traditionally marked by a minimum decline of 20%. 6 Further, it is noteworthy that there was more to this drawdown price action than just a decline in the overall market: the Mag 7 stocks experienced far wider price swings than the S&P 500 index during this stretch. They declined well more than the general market during the February through early April drawdown period, falling on average by 26.8% in price during this timeframe.7 It was the more defensive names and the counter-cyclicals in such areas as utilities and consumer staples, as well as safe havens such as gold, that “led” (eked out modest gains or went down less, that is) in the midst of the turmoil.
On the flip side, however, the Mag 7 handsomely outperformed the overall S&P 500 index by several hundred basis points during the post-April 8 rally that continued through month-end. These wild swings from the downside to the upside in the Mag 7 on a YTD basis, along with the sharp reversal rally in the aggregate S&P 500 index on April 9 cited above, serve as clear illustrations of the importance of portfolio balance and the need for measured responses and positioning to avoid whiplash in this environment of wicked rotations in headline news, market trend and leadership.
We have been cautioning for months to reduce client portfolio imbalances that may have developed over the past several years due to the massive outperformance of certain equity groupings, such as the Mag 7. We’ve encouraged trimming Mag 7 positions back to prudent exposure levels to reduce a portfolio’s vulnerability to them during risk-off selloffs. At the same time, we have championed maintaining appropriately-sized positions in them given their still superior innovation and fundamental characteristics, such as robust earnings growth on an absolute and relative basis.
Bottom line: Overreactions, premature buying or selling, and extreme moves can destroy wealth at sensitive moments like this.
Data Dichotomy Calls for Balance
Regarding asset allocation discussions, we are encouraging clients to “hold your ground” based on the data. By that, we mean that if the robust market returns over the last two years took your stock allocation to well above normal levels, please pare back exposure to your long-term strategic stock allocation and stay there. If you haven’t trimmed back to normal yet, it’s not too late, given that the market is down only approximately 5% on the heels of a 60% cumulative advance in 2023 and 2024.
The fundamental, valuation and technical metrics (FVTs) that drive this conclusion are neutral at this juncture—not excessively and clearly negative, nor excitingly positive in trend like they were in 2023/2024, which inspired us to embrace a more bullish view in those years. Hence the recommendation for neutral/normal stock allocation.
Regarding fundamental data, the “soft” economic survey readings are worrisome as exhibited in the negative trend in consumer, CEO, and small business owner sentiment. The inflation expectations survey readings provided by consumers are also concerning. But the hard data–real Gross Domestic Product (GDP) growth, employment and spending information—is quite solid. In fact, retail sales specifically auto sales, are outright hot. What is unclear at this juncture is whether the solid hard data is simply a mirage driven by pull forward/pre-tariff buying to get ahead of probably higher prices once tariffs kick-in. And will the weak soft data eventually lead to the hard data stalling swiftly once the tariffs take greater effect? These are all things to monitor closely but it’s too early to draw firm conclusions.
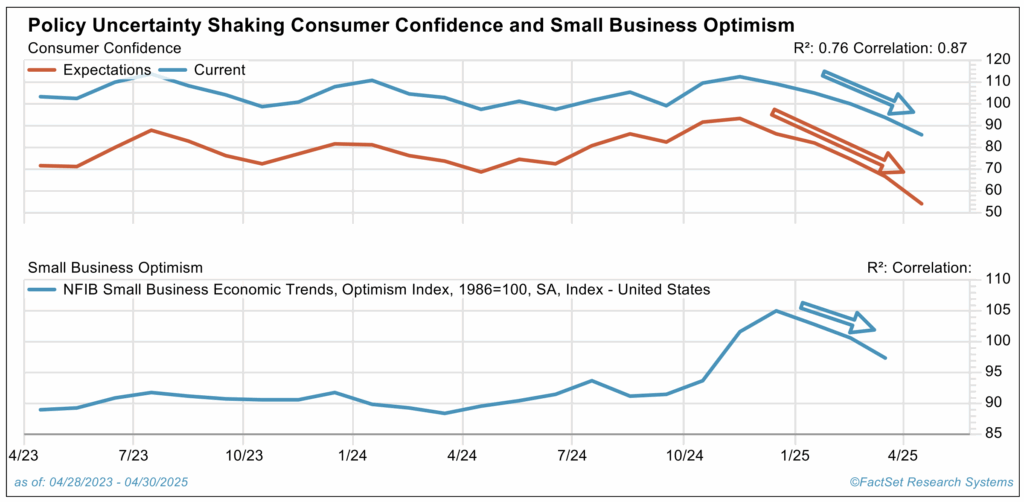
Source: FactSet
We have raised odds of recession to 40%, but our base case still incorporates expectations for modest economic and earnings growth in 2025. It’s still appropriate to think like Walt Whitman on this front, and “be curious, not judgmental.” The data to be released later in May and June will have more impact on our thinking than information reported in April and early May.
On the valuation front, the price-to-earnings (P/E) of the S&P 500 has contracted from 22 to 18 times so far this year; the P/E of the equal weighted S&P 500, which better represents “the other” 493 stocks within the S&P 500, has declined from 18 times to below 15 times, as the headlines and poor soft economic data readings have spooked investors and weakened sentiment.8 So, valuation has become less expensive than it was going into the year. If earnings are not significantly revised downward, this is a helpful development.
Technically speaking, the fact that investors are as bearish as they were at the trough of the 2022 bear market is a contrarian positive. The market ironically tends to do best when sentiment is feverishly negative. The offsets to this constructive tendency, from a technical perspective, are that formation of market bottoms is a process, and while we have seen increasing signs of broad-based selling that is a precondition for recovery, we have not yet seen exhaustive selling on high volume, nor have we seen the momentum thrusts on positive days typical of “the coast is all clear” conditions. We would not be surprised to see a retest of the lows, before moving sustainably higher.
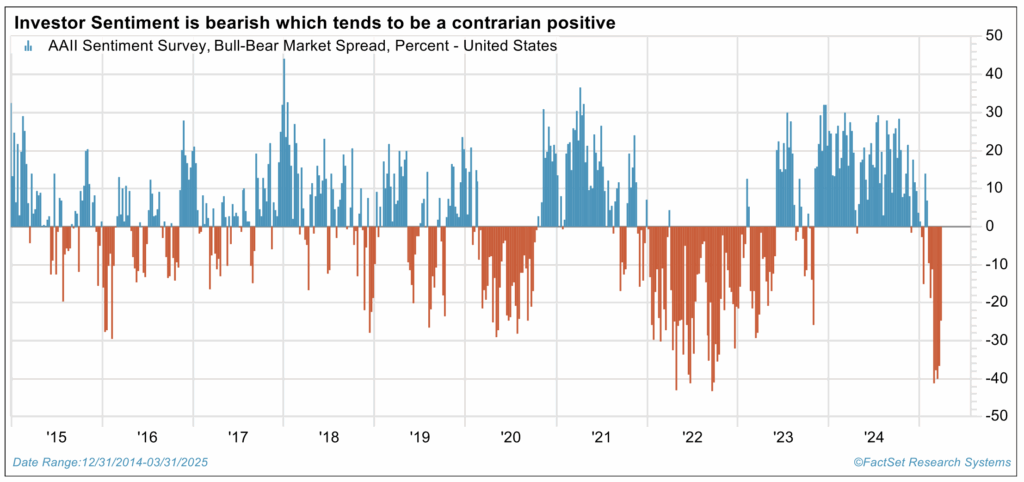
Source: FactSet
Wrap Up
In closing, we would caution from embracing suggestions of some so-called experts and market strategists who are already invoking the “buy on the dips” phrase during the current opaque news flow. This is a bit reckless in my mind, and appropriate only for very long-term and aggressive investors. Instead, we would advise channeling Peter Drucker and clasp onto his thought that it’s not turbulence that we should fear, but the temptation “to act with yesterday’s logic” during moments when uncertainty is elevated.
Respect for the overall neutral nature of the FVTs and cloudiness in its currently unresolved elements—e.g., negative soft data versus positive hard data—calls for patience, balanced positioning and hold your ground thinking. The same was true in 2022 when many experts were predicting recession and market meltdown in reflexive response simply due to an inverted yield curve. The world was a bit more complex than an inverted yield curve back then; the logic was incomplete and faulty. Then, as now, a comprehensive focus on the broader FVT mosaic is required to navigate and avoid whiplash in these financial markets.
Sources:
1-8 FactSet
This commentary is provided for informational and educational purposes only. As such, the information contained herein is not intended and should not be construed as individualized advice or recommendation of any kind.
The opinions and forward-looking statements expressed herein are not guarantees of any future performance and actual results or developments may differ materially from those projected. The information provided herein is believed to be reliable, but we do not guarantee accuracy, timeliness, or completeness. It is provided “as is” without any express or implied warranties.
Asset allocation and diversification are investment strategies designed to help manage risk, but they do not ensure a profit or protect against loss in a declining market.
Equity securities are subject to price fluctuation and investments made in small and mid-cap companies generally involve a higher degree of risk and volatility than investments in large-cap companies. International securities are generally subject to increased risks, including currency fluctuations and social, economic, and political uncertainties, which could increase volatility. These risks are magnified in emerging markets.
Fixed-income securities are subject to loss of principal during periods of rising interest rates and are subject to various other risks including changes in credit quality, market valuations, liquidity, prepayments, early redemption, corporate events, tax ramifications, and other factors before investing. Interest rates and bond prices tend to move in opposite directions. When interest rates fall, bond prices typically rise, and conversely, when interest rates rise, bond prices typically fall.
There is no assurance that any investment, plan, or strategy will be successful. Investing involves risk, including the possible loss of principal. Past performance does not guarantee future results, and nothing herein should be interpreted as an indication of future performance. Please consult your financial professional before making any investment or financial decisions.
The S&P 500 is a capitalization-weighted index designed to measure the performance of the broad domestic economy through changes in the aggregate market value of 500 stocks representing all major industries. S&P 500 Equal Weight Index is designed to track the equally weighted performance of the 500 constituents in the S&P 500 Index. The indexes referenced herein are unmanaged and cannot be directly invested in.
Mag 7 stocks refer to Alphabet, Amazon, Apple, Meta, Microsoft, Nvidia and Tesla.
Investment advisory services are offered through Investment Adviser Representatives (“IARs”) registered with Mariner Independent Advisor Network (“MIAN”) or Mariner Platform Solutions (“MPS”), each an SEC registered investment adviser. These IARs generally have their own business entities with trade names, logos, and websites that they use in marketing the services they provide through the Firm. Such business entities are generally owned by one or more IARs of the Firm, not the Firm itself. For additional information about MIAN or MPS, including fees and services, please contact MIAN/MPS or refer to each entity’s Form ADV Part 2A, which is available on the Investment Adviser Public Disclosure website (www.adviserinfo.sec.gov). Registration of an investment adviser does not imply a certain level of skill or training.
Material prepared by MIAN and MPS.